
1. Introduction
In recent years, China has faced complex and severe challenges: a trade war in 2018, the start of a pandemic in 2020, the real estate turndown in 2021, and the end of “Zero-COVID” in 2022. These challenges, especially the COVID-19 pandemic and its stringent public health measures, have negatively impacted the Chinese economy.
Slowing economic growth since the outbreak of COVID-19, and the uneven recoveries that followed, reflect long-term problems that policymakers must face. More specifically, this paper will cover four aspects of China’s economy: (i) China’s Covid policies and situation, (ii) an overview of China’s GDP growth and international trade, (iii) employment and wages, and (iv) human capital.
Based on these data, we argue that the slowing of the economy does not reflect a normal business cycle, nor can an upturn in the business cycle solve China’s current economic challenges. The data suggest that low and falling domestic and external demand is behind China’s slowing growth. In addition, serious setbacks to entrepreneurship and human capital acquisition due to the pandemic have created long-term structural challenges to economic growth.
2. China’s COVID-19 pandemic and public health policies
In December 2019, the first COVID-19 case was discovered in Wuhan, Hubei province. After hundreds of cases were detected in less than a month, Wuhan was locked down on January 23, 2020. From January 23 to 29, all provinces across the country launched a Level 1 Provincial Response to Public Health Emergency, the highest level.1 The centralized treatment of all confirmed patients, suspected patients, and close contacts of confirmed cases kept many people in quarantine. The local COVID-19 pandemic was controlled by mid-March and Wuhan reopened on April 8, 2020.2 However, the strict restrictions for COVID-19 prevention dramatically reduced all economic activities in China.
After the reopening, cases continued to break out in different places around the country. As a result, China implemented a set of strict pandemic control policies. For example, any community or building with an infected individual would be classified as a high-risk area where inhabitants were forbidden to go out. This “Zero-COVID” policy was implemented in 2021 and continued through the first three quarters of 2022.
In the meantime, the pressure for the government to ease Covid-restrictions mounted. Then, in November 2022, China suddenly eased the restrictive measures, abolishing “Zero-COVID.” This change was wide-sweeping and included canceling the classification of risk areas, canceling the suspension of businesses, and letting patients be treated at home instead of in isolation areas. As a result, China experienced an infection peak in the fourth quarter of 2022 causing another sharp drop in economic activities. After that, China gradually returned to pre-pandemic life in the first quarter of 2023.
Stringent public health measures were in place for almost three years in China. The economic activities of enterprises, especially small and micro enterprises, were severely impacted. The costs of continuing this stringent policy were enormous. Over the past three years, the tight public health measures and lockdown have had a large, negative impact on growth in China.
3. Economic growth and international trade
Since the economic reform and opening of the Chinese economy in the late 1970s, economic growth in China has been in the range of 9%-10% annually on average, regarded by many as the “China Miracle.” However, such dramatic growth started to slow starting from 2012. GDP growth steadily declined to 7%-8% from 2012-2015, slowing to 6%-7% from 2016 to 2019, as shown in Figure 1.
Figure 1: China’s GDP
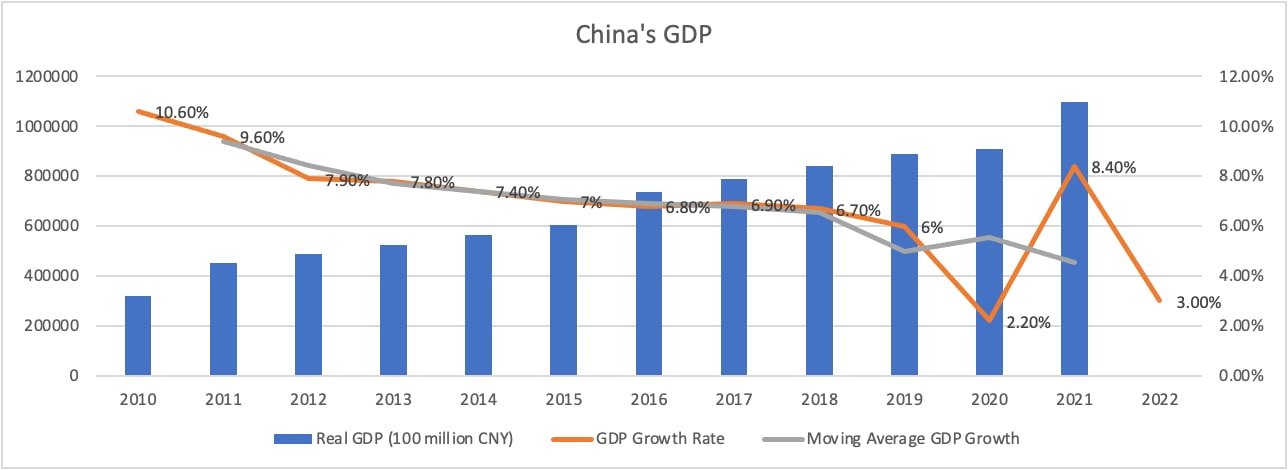
Sources: National Bureau of Statistics, website: https://data.stats.gov.cn/easyquery.htm?cn=B01&zb=A0102&sj=2022C
and World Bank, website: https://thedocs.worldbank.org/en/doc/b8644c8a79ee3376b2cd3c16a9f90cc7-0070012022/original/CEU-December-2022-ENG.pdf
3.1 Economic growth
After the outbreak of COVID-19 in December 2019, the normal economic growth of 6% suddenly dropped to 2.2% in 2020. The unprecedented pandemic hindered consumer demand, production, investment, and international trade. In 2021 growth bounced back to 8.4% from a relatively very low base in 2020. In 2022, with the recurrence of the COVID-19 pandemic and the strict “Zero-COVID” policy, growth dropped into the 3% range. To remove large fluctuations in GDP growth during the Covid period, we calculated a three-year moving average of economic growth. As shown in Figure 1, the three-year moving average shows a continuous downward trend in the pre-pandemic period followed by a sharp decrease during the pandemic (2019-2022).
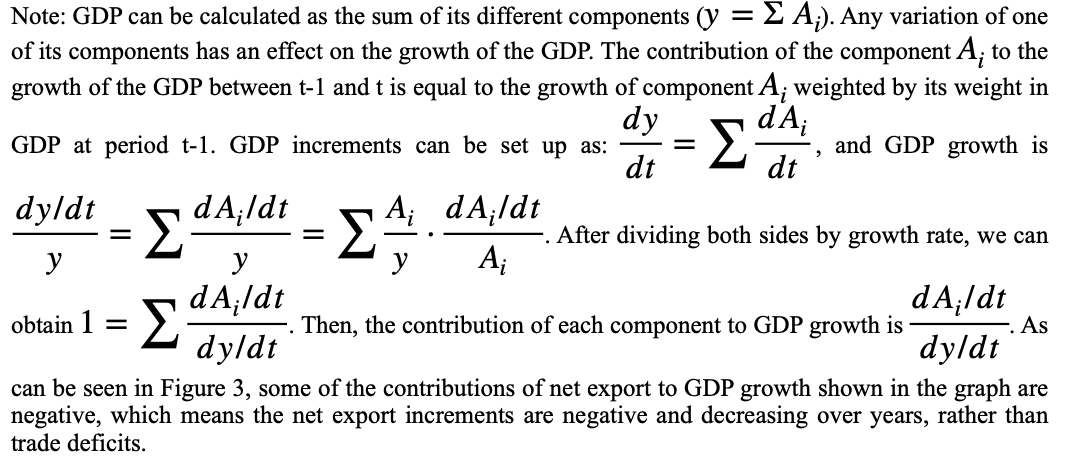
As an important part of economic growth, from 2010 to 2019, consumption’s contribution to growth on average was approximately 60% annually. However, the contribution of consumption became negative and dropped sharply to -6.8% in 2020 as shown in Figure 2.
Figure 2: Contribution to GDP growth

Although it rebounded to 58.3% in 2021, it declined sharply again to 32.8% in 2022. The COVID-19 pandemic has made this much worse. In 2020, investment contributed to 81.5% of growth, much higher than the 42% average from 2010 to 2019 of 29%. In 2022, the contribution of investment was a bit more balanced at 50%.
Most analysts believe that domestic consumption in China is too low, leaving the economy dependent on investment and especially government investment. If China wants to raise economic growth, stimulating consumption is key. Over-investment hurts productivity while consumption-driven growth is more likely to meet the needs of society. However, given the lower income and declining confidence for the future, it remains a major challenge for the government to drive up domestic consumption.
3.2 International trade
China for years has relied on exports, especially labor-intensive products, as an engine of economic growth. However, since the outbreak of the pandemic and the trade war between China and the U.S., uncertainties in the global economy have dramatically increased. In the meantime, international trade protectionism has become increasingly geared toward China, partly due to the changing political environments inside and outside China. These tensions pose risks to international trade and foreign direct investment (Gita Gopinath, 2022).
Figure 3: China’s export and import
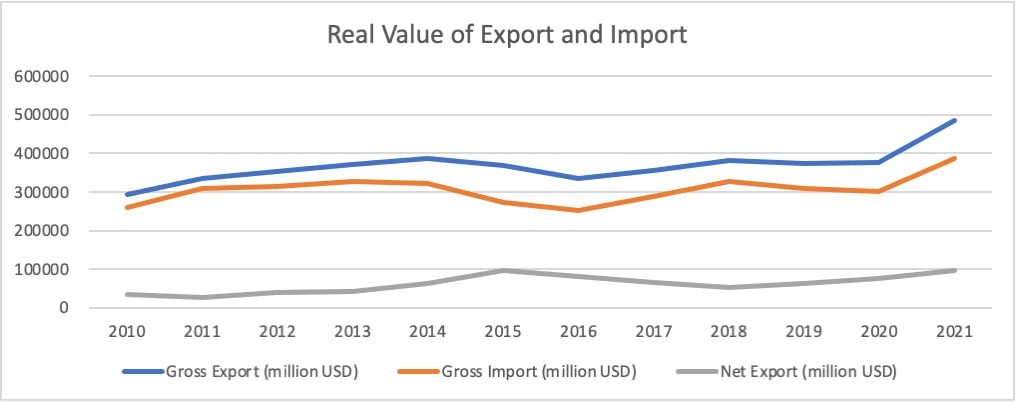

The data in Figure 3 show that, during the Covid period, China’s total imports and exports declined slightly from 2019 to 2020 but recovered and increased in 2021. The trade surplus continued upward. However, the figures for international trade based on revenue may not give a real picture. Due to the pandemic and Russia’s invasion of Ukraine, prices for some goods in international markets increased dramatically. The trade volume is compared using real values adjusted by the price index (to take inflation into account). However, because of abnormal price fluctuations in the international market, the price indexes sometimes seriously underestimated the price hike for some goods. As a result, some of China’s major export goods did not increase much in quantity although increased in revenue (International Monetary Fund, 2022). For example, pharmaceuticals are a major category of exports from China. Even after adjusting by the price index, as shown in Figure 4, the value of pharmaceuticals exported shows substantial growth from 2020 to 2021. However, the quantities exported increased much slower. The same phenomenon can also be found in steel, another major export from China.
Figure 4: Growth in value and quantity of exported pharmaceuticals and steel

4. Employment and income
4.1 Unemployment
Overall, the impact of the pandemic and the “Zero-COVID” policy on foreign-invested companies across China was vast. The COVID-19 pandemic with its tight restriction measures and other changes occurred in China accelerated the closing of foreign-invested firms, such as Toshiba, Nikon, and Samsung. For example, at the beginning of 2022, Canon closed its factory in Zhuhai, ending its 32-year history in China and laying off 1,300 employees. At the end of 2022, social media was abuzz about whether Foxconn would withdraw from China. If they did, unemployment would increase in Henan by tens of thousands of people.
The data from the China Foreign Investment Statistics Bulletin and National Bureau of Statistics show the scale of withdrawal of foreign-invested firms. The number of newly established foreign-invested enterprises was approximately 39,000 in 2020 and 48,000 in 2021.3 However, during the same period, a total of 102,000 foreign-invested enterprises exited China in 2020 and 109,000 exited in 2021.4 The number of foreign companies that withdrew was more than double those newly established.
Moreover, during the COVID period, a large number of private companies closed. For example, data from Tianyancha, a platform for collecting and sharing business information, show that in the first quarter of 2022 alone, more than 460,000 small and medium-sized private enterprises ceased operation. In China, private enterprises absorb about 80% of the employment in the economy.5 Their closure will have a lasting impact on the country’s employment.
This withdrawal of foreign companies and the closure of domestic enterprises inevitably aggravated the unemployment problem. It emerged — especially for youth workforce —in China during the pandemic. According to the national data, since 2018, the surveyed urban unemployment rate has increased, from below 5% to as high as 6.2%. By the end of 2022, China’s surveyed urban unemployment rate remained around 5.5%.
Figure 5: Surveyed urban unemployment rates
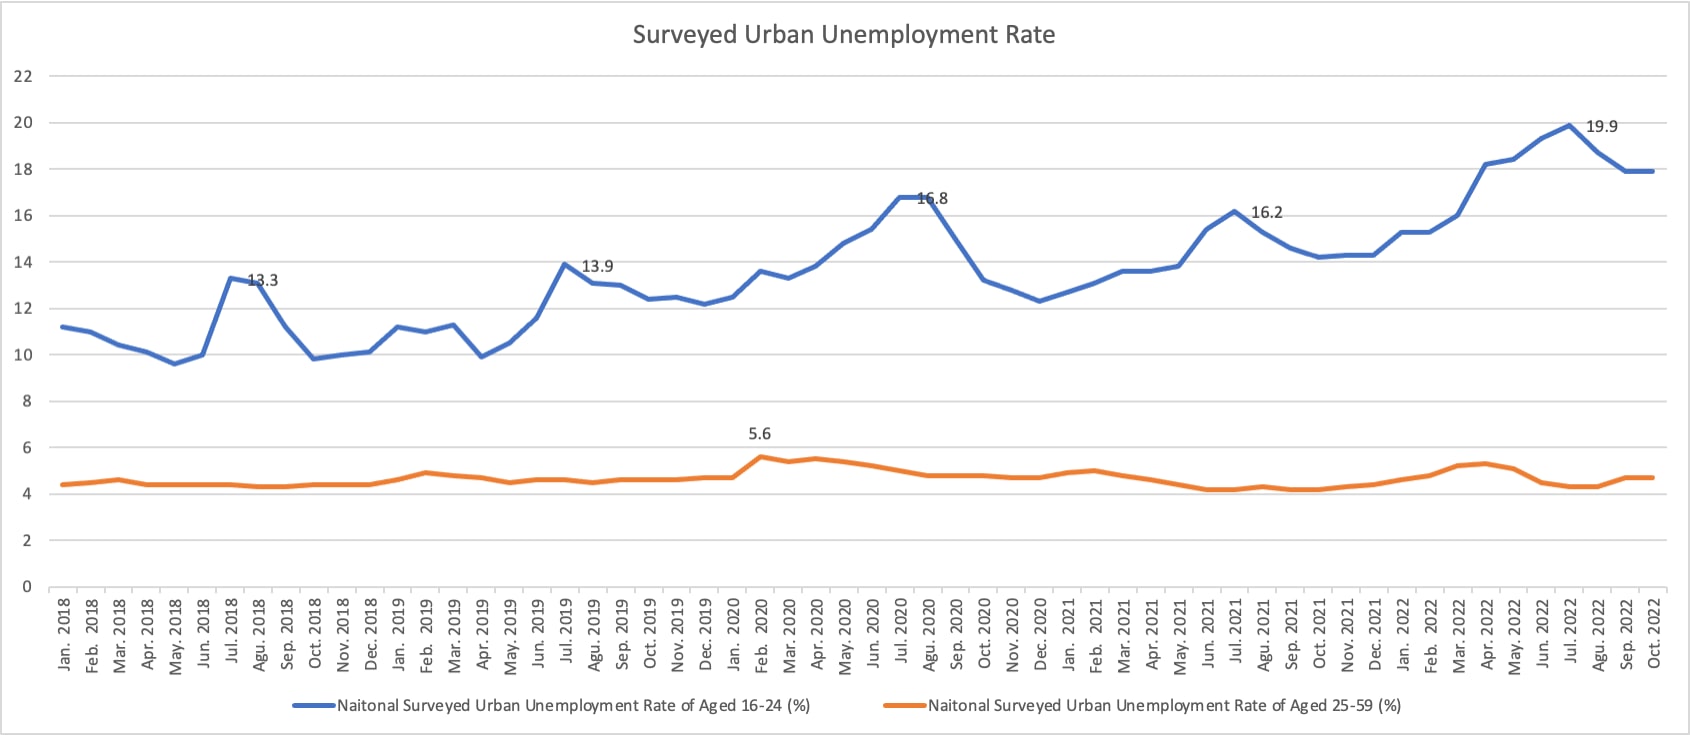
However, the youth unemployment rate for those aged 16-24 has been three or four times higher than those aged 25-59. As shown in Figure 5, the unemployment rate of young workers rose five percentage points since January 2020. It also shows a clear upward trend, from 10%-12% to as high as 20%. College students, a large part of the youth workforce, are facing fierce competition for jobs. The number of graduates searching for jobs reached 9.09 million in 2022, with was an historical high. The large inflow of labor market entrants added to an already serious unemployment situation during the pandemic.6
4.2 Disposable income and expenditure
As the GDP growth rate dropped from 6% to 2.2% in the 2020, the growth rate of real wages of those employed in urban areas also dropped from 6.8% to 5.2%, the lowest point in the last decade.7 Moreover, as shown in Figure 6, the growth of disposable income of urban and rural residents has shown a decrease since 2014. It dropped sharply at the beginning of COVID-19 in 2020 and remained negative until early 2021. Growth rebounded in early 2021 and then continued to decline to below 4.3% in rural incomes and 2.3% in urban incomes by the end of 2022.
Figure 6: Per capita disposable income and per capita expenditure growth
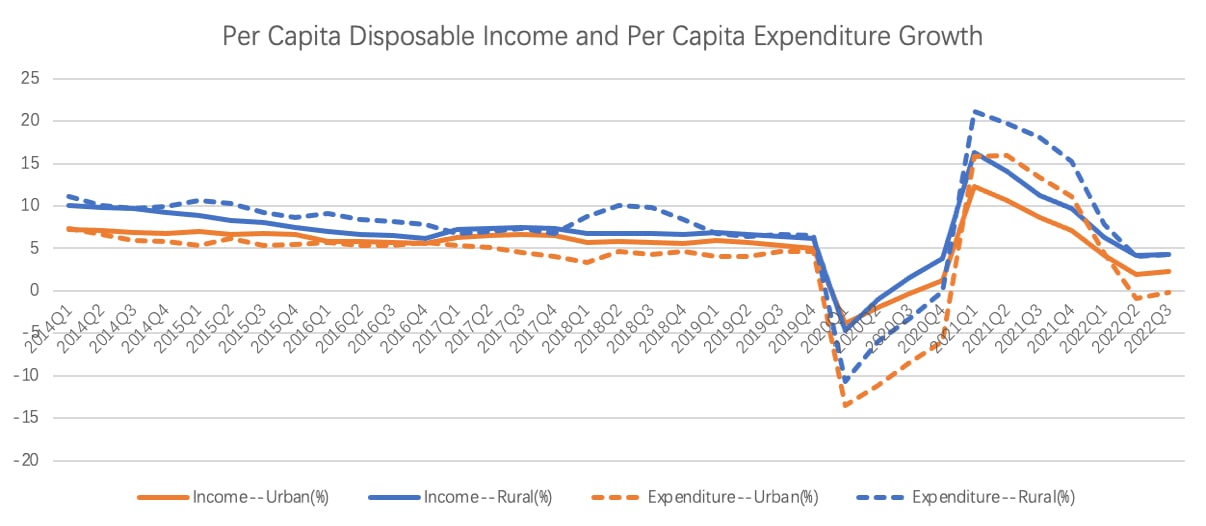
Source: National Bureau of Statistics, website: https://data.stats.gov.cn/easyquery.htm?cn=B01
5. Human capital of the youth
Chinese youth have been under pressure to find employment in recent years. Although it is common for young people newly entering the labor market to face challenges in finding good jobs, youth opportunities were further diminished by the COVID-19 pandemic.
5.1 Risk-taking and entrepreneurship
The younger generations seem to be more risk-averse than previous generations, as they appear to prefer safe jobs with less challenge and more stability. Such a phenomenon could also be related to the change in the political atmosphere in China. Young people view jobs in the government and state-owned sector as better career opportunities. The frequent and lasting lockdown in China due to the “Zero-COVID” policy in the past three years reinforced such attitudes, i.e., to avoid risk as much as possible. Young people today are more inclined to work in government and state-owned sectors and are less willing to work in private and foreign enterprises.
Figure 7: Sector distribution of the placement for new college graduates
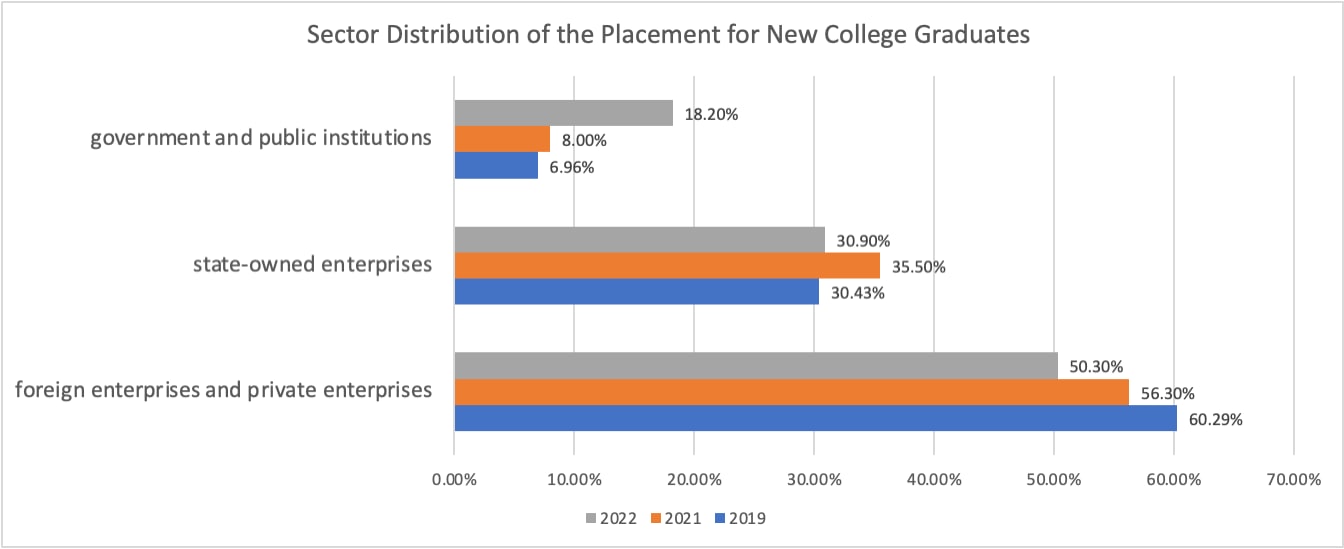
For example, as shown in Figure 7, the proportion of college graduates going to government agencies, public institutions, and state-owned enterprises has increased steadily in the past three years, from 37.39% in 2019 to 49.1% in 2022. Likewise, the proportion going to foreign and private enterprises has decreased year by year. In the three-year period, the proportion of new college graduates going to foreign and private enterprises has declined by 10 percentage points, while those working for the government increased by more than 11 percentage points. This trend is a sharp reversal compared with the early stage of reform and opening in China during the 1980s and 1990s when college students were more interested in joining private sectors after graduation.
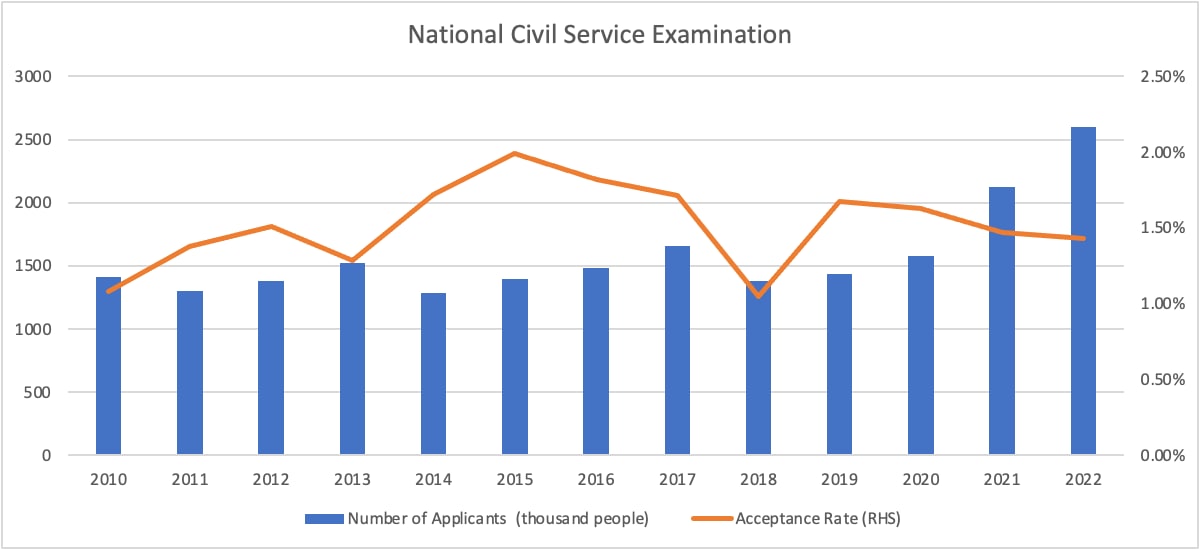
One reason for the increased proportion of college graduates’ job placement in the public sector could be that the government is getting bigger and employs more people. In this case, the trend may not reflect the change in preference for job searches. However, the number of applicants for the national civil service examination increased from less than 1.5 million in 2010 to more than 2.5 million in 2022 as shown in Figure 8. The number of applicants shows an increasing trend, but the acceptance rate started to decline in 2015, from 1.99% to 1.05% in 2022. Moreover, starting in 2019, the number of applicants rose steadily but the acceptance rate dropped continuously. It is unclear how much the Zero-COVID policy contributed to the trend. However, the extremely high competition to get into the government sector as civil servants demonstrates the changing preferences of young college graduates.
Figure 8: National civil service examination
5.2 The Impact of school closure
The Zero-COVID policy in the past three years has caused widespread school closures from elementary schools to colleges. For example, China extended the 2020 Spring Festival holiday, delaying the start of the spring semester for all primary, secondary schools, and colleges. Moreover, online teaching became normal as a substitution for in-person teaching. For example, based on data from the Ministry of Education, a total of 1,454 universities launched online teaching, in which 1.03 million teachers offered 1.07 million courses online, with a total of 12.26 million courses. A total of 17.75 million college students participated in online learning.8 Such practices have had significant impact on the quality of education because of the inadequate communication between students and teachers in an online setting.
Although the data from China are not sufficient to do an in-depth study, existing studies using data from other countries show the impact of school closure on student human capital accumulation. For example, a survey conducted in the United State shows that COVID-19 has led to 13% of college students delaying graduation, 12% of students intending to change majors, and 40% losing a job or job offer. These students report a decreased interest in taking online courses, and moreover, honor students show a stronger preference for in-person classes (Aucejo et al., 2020).
Researchers studied the negative impact of online teaching on primary students in the short and long term. For example, they found that the learning progress of primary school students during an eight-week school closure was 2.4% slower than before the school closure, and the learning speed of secondary school students was 0.4% slower (Tomasik et al., 2021). Based on a study using data from Argentina, a reduction of in-person teaching time in primary schools by half a year reduced long-term earnings by 3.2% for men and 1.9% for women (Jaume and Willen, 2019).
In the last three years since 2019, widespread school closures have been common in China. Almost all schools closed for at least three months in the Spring of 2020, and for many places lasted for as long as a whole year. As such, the negative impacts of school closure and online teaching on education quality and future earnings would last for a few generations in China. Its effects on the country’s human capital accumulation, unemployment, innovation, and economic growth are yet to be further investigated.
6. Conclusion
The COVID-19 pandemic caused declining consumption, production, and all economic activities, resulting in lower economic growth in China. Because of strict public health measures, we saw a slowdown of new foreign-invested enterprises and accelerated closure of existing ones. Unemployment problems also rose during the pandemic, especially for young workers. Moreover, the diminishing aptitude for entrepreneurship and risk-taking spirit among young people and online teaching due to the school closures may contribute substantially to slowing youth human capital accumulation.
China’s economy is standing at a crossroads. Its growth, employment, and human capital have recently experienced significant fluctuations and even downturns. To confront this instability, the deep causes of these problems need to be further explored. An upturn in the business cycle is not likely to be sufficient.
References
- Aucejo E M, French J, Araya M P U, et al. The impact of COVID-19 on student experiences and expectations: Evidence from a survey [J]. Journal of Public Economics, 2020, 191: 104271.
- Gita Gopinath, IMF Staff Completes 2022 Article IV Mission to the People’s Republic of China. 2022. https://www.imf.org/en/News/Articles/2022/11/21/pr22401-imf-staff-completes-2022-article-iv-mission-to-the-peoples-republic-of-china
- Guénette J D, Kose M A, Sugawara N. Is a Global Recession Imminent? [J]. Available at SSRN, 2022.
- International Monetary Fund, Crisis upon Crisis—IMF Annual Report 2022. 2022. https://www.imf.org/external/pubs/ft/ar/2022/downloads/imf-annual-report-2022-english.pdf
- Jaume D, Willén A. The long-run effects of teacher strikes: evidence from Argentina [J]. Journal of Labor Economics, 2019, 37(4): 1097-1139.
- Tomasik M J, Helbling L A, Moser U. Educational gains of in‐person vs. distance learning in primary and secondary schools: A natural experiment during the COVID‐19 pandemic school closures in Switzerland[J]. International Journal of Psychology, 2021, 56(4): 566-576.
- World Bank, Navigating Uncertainty—China’s Economy in 2023. 2022. https://thedocs.worldbank.org/en/doc/b8644c8a79ee3376b2cd3c16a9f90cc7-0070012022/original/CEU-December-2022-ENG.pdf
- World Bank, Global Economic Prospects. 2023. https://openknowledge.worldbank.org/bitstream/handle/10986/38030/GEP-January-2023.pdf
- The State Council of China: http://www.gov.cn/zhengce/2020-06/07/content_5517737.htm ↩
- Central People’s Government of the People’s Republic of China, website: http://www.gov.cn/zhengce/2020-06/07/content_5517737.htm ↩
- China Foreign Investment Statistics Bulletin 2022: http://images.mofcom.gov.cn/wzs/202211/20221102151438905.pdf ↩
- China’s National Bureau of Statistics: https://data.stats.gov.cn/easyquery.htm?cn=C01&zb=A0601&sj=2021 ↩
- China’s National Bureau of Statistics: https://www.ndrc.gov.cn/wsdwhfz/202203/t20220308_1318814.html?code=&state=123 ↩
- China’s National Bureau of Statistics: http://www.stats.gov.cn/xxgk/jd/sjjd2020/202104/t20210416_1816485.html ↩
- National Bureau of Statistics, website: https://data.stats.gov.cn/easyquery.htm?cn=C01&zb=A0601&sj=2021 ↩
- The Ministry of Education of the People’s Republic of China, website: http://www.moe.gov.cn/fbh/live/2020/51987/mtbd/202005/t20200518_455656.html ↩
